
In the fast-paced world of investing, staying ahead of the curve often means tapping into unconventional data sources. Investor sentiment—the collective mood of market participants—can drive price swings before traditional indicators catch up. One powerful, free tool for gauging this is Google Trends, which tracks search volume for keywords over time. By analyzing the Google Search Volume Index (GSVI), traders/ investors can spot emerging trends and even anticipate market shifts. This guide dives into how to leverage GSVI for sentiment analysis, complete with step-by-step examples from 2025-2026 data, and explores its correlations with trading volume. Whether you’re a seasoned trader or a new investor, understanding “investor sentiment Google” searches could give you an edge in predicting stock market moves.

What is Investor Sentiment and Why Use Google Trends?
Investor sentiment refers to the overall attitude of investors toward a particular asset, sector, or the market as a whole. High sentiment often signals optimism and potential rallies, while low sentiment can foreshadow downturns. Traditional gauges like the VIX (fear index) or surveys are useful, but they lag behind real-time behavior.
Enter Google Trends: It provides the GSVI, a normalized score (0-100) representing relative search interest for a term. Higher scores indicate peaks in public curiosity, which often aligns with market activity. Studies show that GSVI can predict stock returns, volatility, and even revenue estimates before official reports. For instance, spikes in searches for “recession” have historically preceded economic slowdowns, while terms like “buy Bitcoin” surge before crypto booms.
Why does this work? Google processes billions of searches daily, capturing raw, unfiltered public interest. As one study notes, query volumes anticipate trading peaks by one or more days, reflecting collective user behavior on the web. This makes it a leading indicator for sentiment-driven markets.
Leveraging GSVI for Sentiment Analysis: A Step-by-Step Guide
Ready to try it yourself? Here’s how to use Google Trends to analyze investor sentiment and predict potential market moves. We’ll focus on practical steps with recent examples from 2025-2026.
Step 1: Access Google Trends and Select Your Query
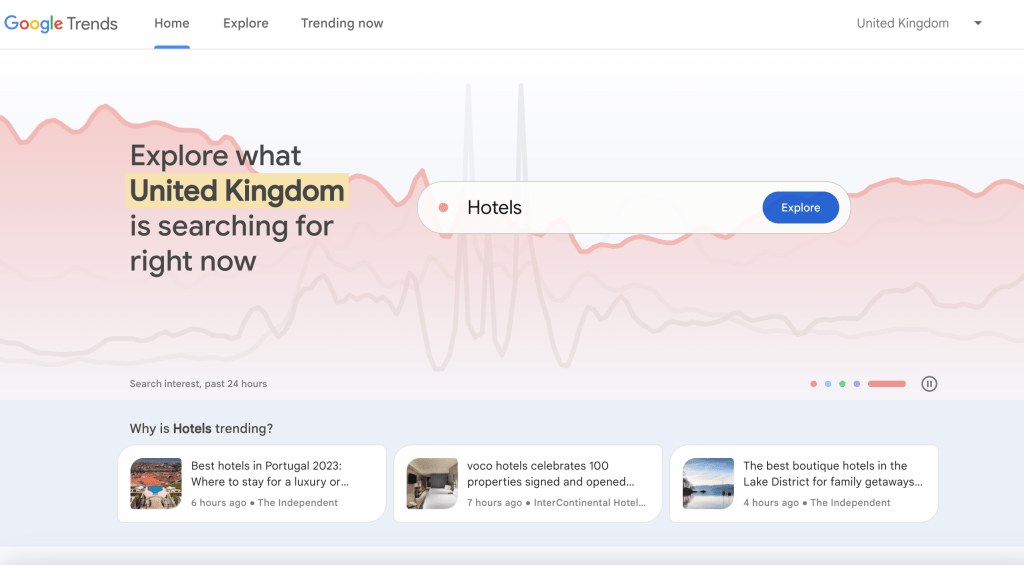
Head to trends.google.com. Enter a keyword relevant to your analysis, such as “investor sentiment Google,” “stock market crash,” or a specific asset like “Bitcoin price.” Filter by region (e.g., Worldwide or United States) and time frame (e.g., past 12 months for recent trends).
Pro tip: Use advanced operators for precision. Compare multiple terms, like “buy stocks” vs. “sell stocks,” to gauge bullish vs. bearish sentiment.
Step 2: Analyze the GSVI Data
The tool displays a line chart of search interest over time. Look for:
- Peaks and Troughs: Sudden spikes often signal heightened attention, which can precede price volatility.
- Regional Breakdowns: See where interest is growing (e.g., emerging markets for global plays).
- Related Queries: These reveal associated trends, like “EV stocks” linking to “electric SUV” searches.
Download the data as a CSV for deeper analysis—overlay it with stock charts using tools like Excel or Python.
Step 3: Correlate with Market Data
Compare GSVI trends to actual market performance. Use free sites like Yahoo Finance for historical prices. For example:
- If GSVI for “recession” spikes, check S&P 500 futures for potential dips.
- Track correlations: High GSVI often leads to increased trading volume and returns.
Step 4: Test and Refine
Backtest your queries against historical data. Adjust for seasonality (e.g., tax-related searches peak in April) and avoid overfitting by testing multiple terms.
Real-World Examples from Recent Data (2025-2026)
Let’s apply this to 2025-2026 events, drawing from studies and market history. These illustrate how GSVI predicted moves in stocks and crypto.
Example 1: Electric Vehicles (EV) Market Surge
In early 2025, searches for “electric SUV” spiked, mirroring a 31.9% CAGR projection for the global EV market toward $4.33 trillion by 2030. This GSVI uptick preceded BYD overtaking Tesla in EV market share, with BYD hitting 1.61 million units sold by September 2025 vs. Tesla’s 1.22 million. Traders who spotted this could have positioned for gains in EV stocks like TSLA or BYD, as search volume led actual sales outcomes.
During January 2025 to February 2026, similar patterns emerged: GSVI for EV-related terms anticipated stock rallies in the sector, aligning with broader market optimism as the S&P 500 climbed to around 6,909 by mid-February 2026.

Example 2: Bitcoin’s Volatile Ride
Bitcoin’s price history in 2025-2026 offers a textbook case. GSVI for “Bitcoin” surged before major price milestones. For instance, searches peaked in late 2025 as BTC hit an all-time high of over $126,198 in October, before dipping to $110,000. By February 2026, BTC hovered around $68,000, with GSVI trends showing renewed interest correlating to a 27.63% potential ROI forecast for the year.
Step-by-step application:
- Query: “Bitcoin” from January 2025 to February 2026.
- Observation: Spikes in mid-2025 preceded a climb from $87,508 (December 2025) to highs in early 2026.
- Prediction: Rising GSVI often signaled buying pressure, leading to volume increases and price upticks.
A 2025 study on tech stocks found GSVI positively correlated with returns and trading volume across periods, growing stronger with Google’s popularity

Example 3: Broader Stock Market Sentiment
For the S&P 500, GSVI for “stock market crash” or bullish/bearish terms predicted volatility. In January 2026, the index gained 1.45%, hitting highs near 7,000 amid AI and chip stock optimism. Earlier, in 2025, searches for “AI stocks” foreshadowed Nasdaq’s 21.14% YTD gain.
Correlations with Trading Volume: The Key Link
GSVI doesn’t just predict prices—it strongly correlates with trading volume, a proxy for market liquidity and activity. Multiple studies confirm this:
- A 2012 analysis of NASDAQ-100 stocks showed daily query volumes correlating with trading volumes, often anticipating peaks by a day.
- Recent 2025 research on GSVI as an investor attention proxy found positive links to volatility and volume, regardless of keywords or regions. Higher attention boosts trading, as retail investors (dominant in some markets) react to news.
- In Japanese startup stocks, GSVI positively tied to returns and liquidity, with immediate return increases not reversing long-term.
- For U.S. stocks, 2025 data revealed GSVI predicting excess returns and abnormal volumes in retail-heavy indices like TPEx 50.
In 2025-2026, this played out: Bitcoin’s GSVI spikes aligned with volume surges during its climb to $126k, while S&P 500 volume rose with sentiment-driven searches amid geopolitical tensions. Traders can use this to time entries—high GSVI often means impending volume spikes, signaling momentum.

Tips for Investors and Traders,
- Combine with Other Tools: GSVI shines when paired with technical analysis or fundamentals.
- Avoid Pitfalls: GSVI measures interest, not direction—context matters. Bullish searches can overheat markets.
- Ethical Note: This is for informed decisions, not guarantees. Markets are unpredictable.
- Advanced Use: Scrape data for custom models, as in 2026 tools for real-time insights.
Conclusion: Unlock Market Insights with GSVI
Google Trends transforms “investor sentiment Google” from a vague concept into actionable intelligence. By following the steps and examples above, you can spot correlations with trading volume and predict moves, as seen in EV and Bitcoin trends from 2025-2026. In a market where data is king, GSVI offers a democratized edge—start exploring today to stay ahead.
Enjoy reading all things finance and psychology? Check out the top books we recommend for traders/ investors on Amazon.
Leave a Reply